Adding pre-attentive attributes to your Tableau Charts
Once you create your basic chart, the next step is to add pre-attentive attributes to highlight the key insight.

Highlighting a single bar
1. Right click on Age in Dimensions and select create group
2. Select all 20’s and click on group. Create a groups for 30s, 40s, and 50s. You should have four sub-groups.
3. Now drag the newly created group to the Color tab in Marks card.
4. Click on the color tab and then on edit colors.
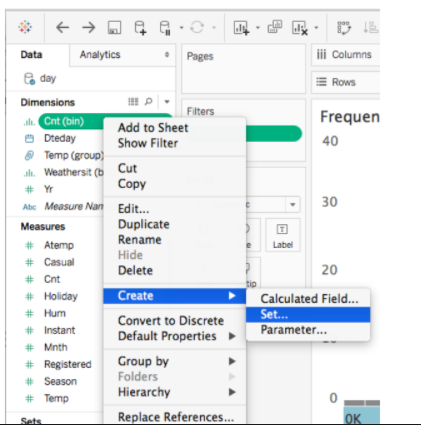
Use sets to change colors of specific encodings for more complex data
1. RIght click on the variable in the Dimension in the data pane.
2. Select create > set.
3. In the Create Set dialog box, type a name for the set.
4. On the General tab, select one or more values to be included in the set.
5. Drag the newly created set to Color tab in Marks card and select the color that you would like to use to highlight the data in the set.