
Visualizing Free Wi-Fi Hotspots in NYC Using a Table
By Kristen Sosulski
How To Make a Table in Tableau?
1. Download my sample file at: http://bit.ly/nyc_wifi
2. Import file into Tableau
3. Click “Sheet 1” and observe the dimensions and measures on the left-hand side
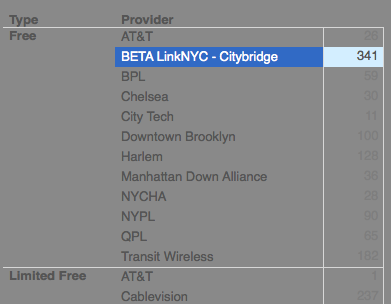
4. Drag Type and Provider from Dimensions to Rows at the top of your screen under Columns
5. Select “Square” under the selection menu from Worksheet > Show Cards > Marks
6. Drag Number of Records from Measures to the “Colors” card under Marks
7. Drag Number of Records from Measures again to the “Label” card under Marks