Lab 6 Interactive multivariate
In this lab, we will build radar plot.
6.1 Radar plot
Objective: Show the game performace of two tennis opponents.
Data
Select a specific match from a https://www.usopen.org/en_US/scores/stats/1701.html
STEP 1 * Build your data structure. Open Excel and enter in your data. As an alternative you can use the data below. Download at: http://becomingvisual.com/datavislab/tennis_radar.xlsx
An alternative is to just view the example at: http://becomingvisual.com/datavislab/radar_tableau.twbx
library(readxl)
tennis_radar <- read_excel("tennis_radar.xlsx")
head(tennis_radar)
## # A tibble: 2 x 7
## Player Aces `Double Faults` `First Serve in… `Win percentage… Winners
## <chr> <dbl> <dbl> <dbl> <dbl> <dbl>
## 1 DelPo… 6 2 64 67 31
## 2 Djoko… 1 1 63 68 32
## # … with 1 more variable: `Unforced errors` <dbl>STEP 2
Check to ensure you have Tableau version 2018.3 or greater installed. If not, install it now. We will be using the Extensions object in the dashboard view to build our radar chart. Extensions are only available in versions 2018.3 or later.
STEP 3 Import the Excel file into a new Tableau workbook. Take a look at the data and observe the variables.
You’ll probably want to pivot your data. Organize it as shown in 6.1.
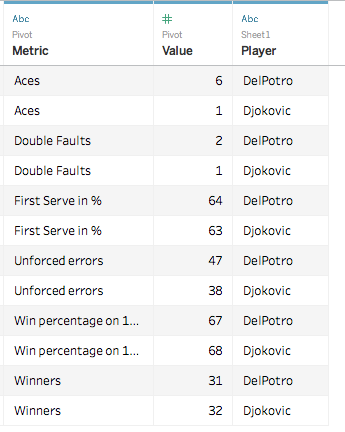
Figure 6.1: Data transformed to long format
STEP 4
- Create a simple stacked bar as shown below.
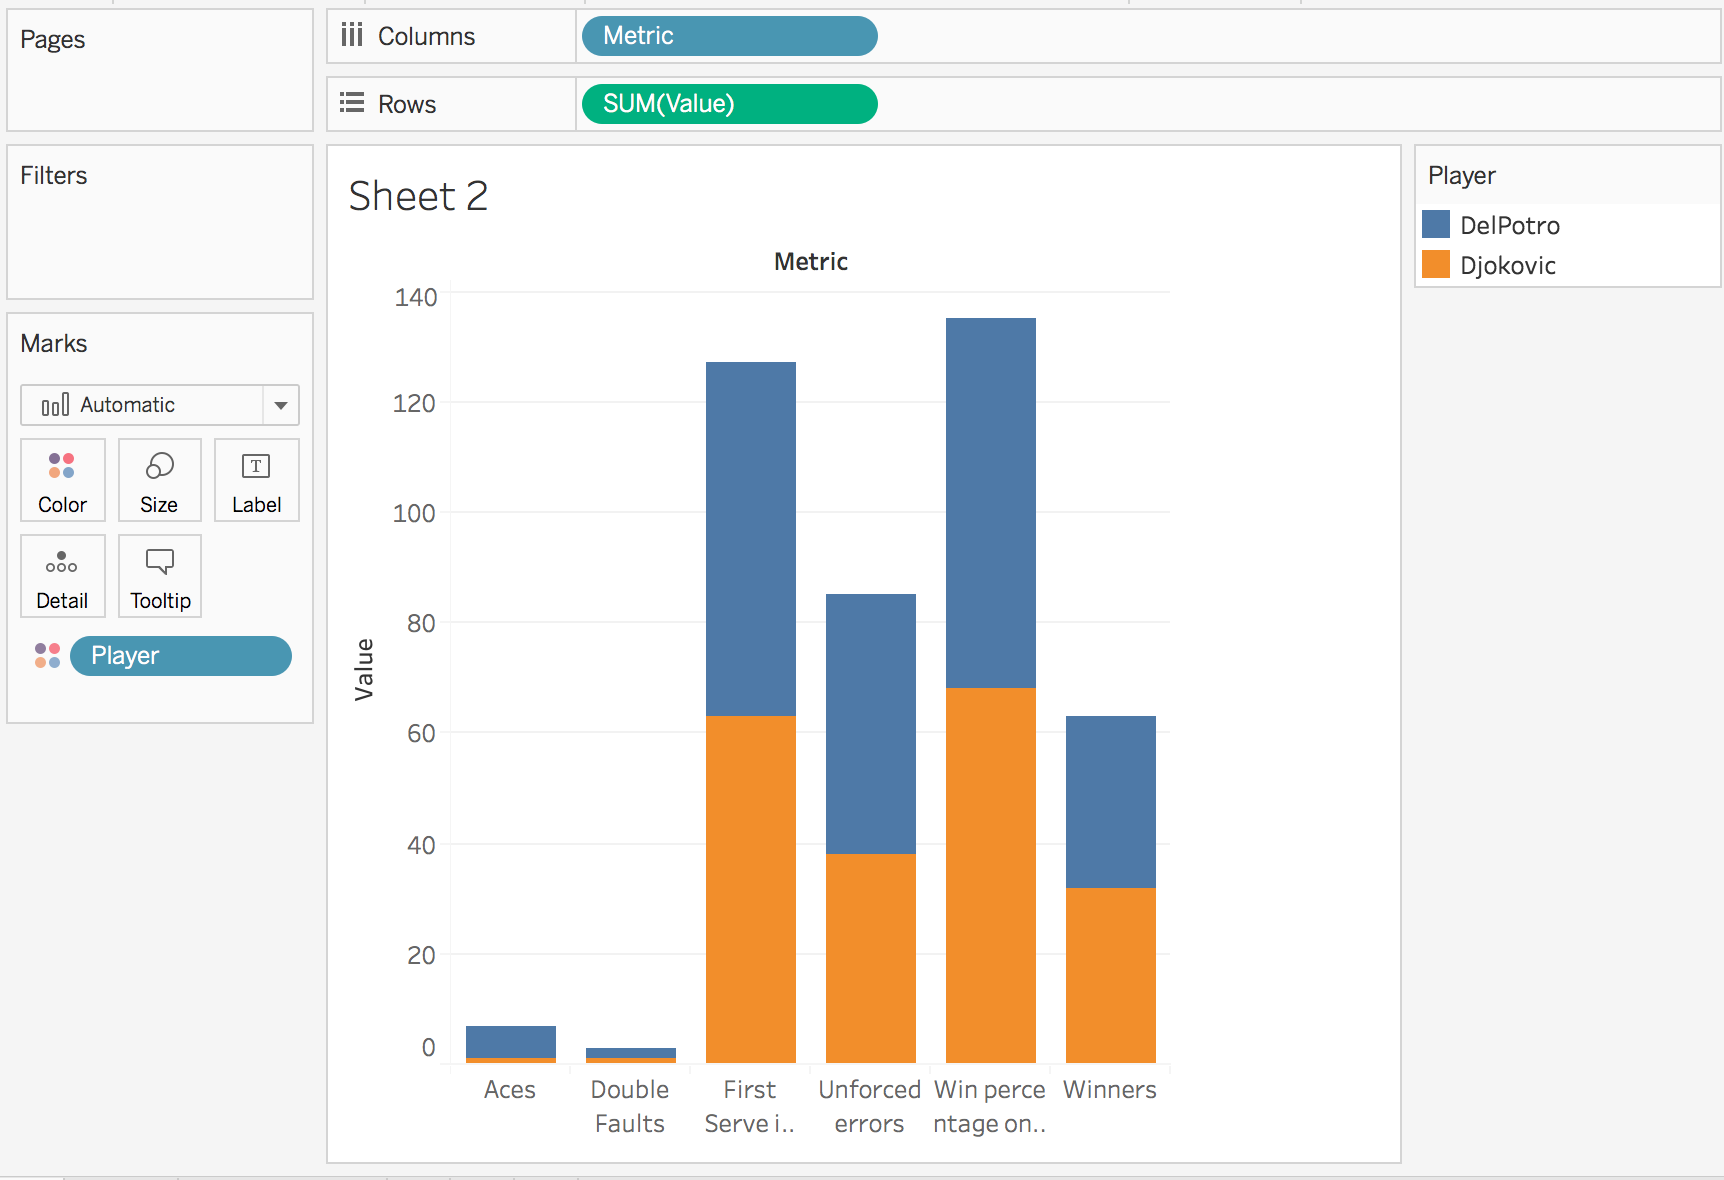
Figure 6.2: Stacked bar that will be used to build the radar chart
STEP 5
- Create a new dashboard
- Drag the worksheet with the stacked bar to the dashboard
- Select Extension on the Objects portion of the dashboard and drag it to your dashboard. This will prompt a pop-up. *Choose extension gallery.
- Download the Show Me More extension. You will be required to login to Tableau or create a Tableau account
STEP 6
Once you download the extension, you will be prompted return back to the extensions gallery OR select My Extensions. * Select My Extensions * Navigate to the extension you just downloaded.
* Use configure to get started * Select Radar chart and the options as shown below.
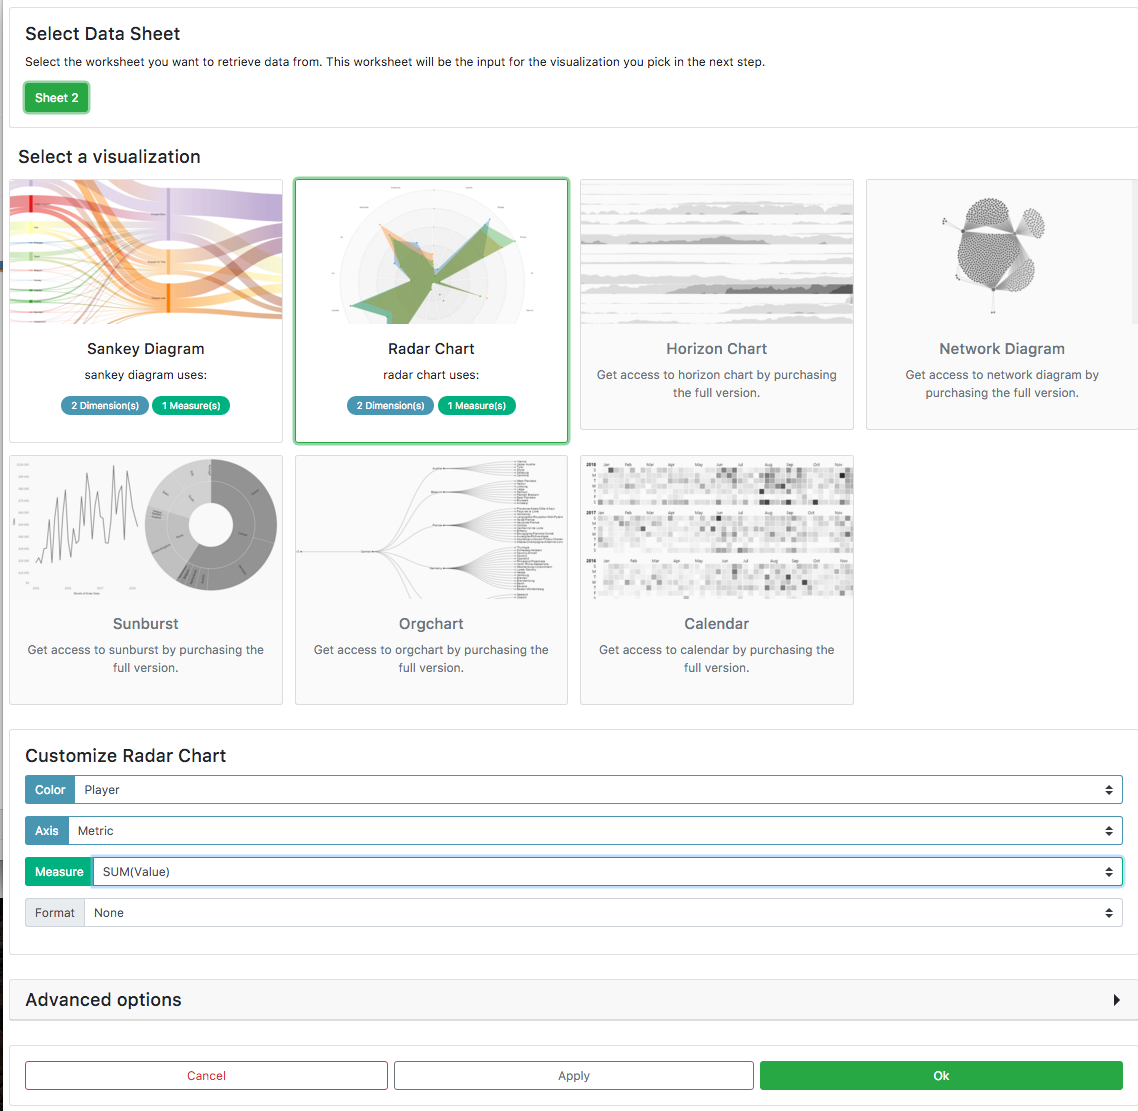
Figure 6.3: Show me more
Step 7
Select Ok. See your radar chart as displayed below.
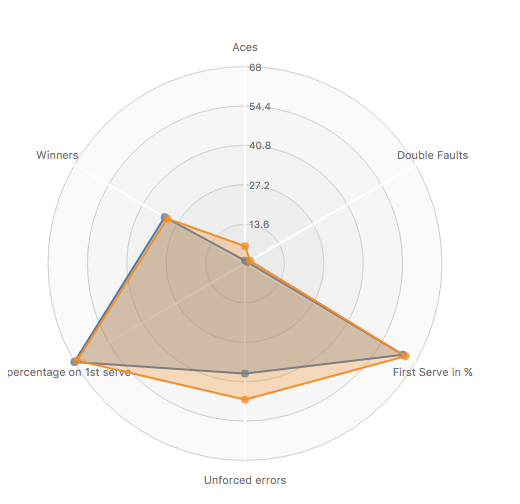
Figure 6.4: Radar chart build with the show me more extension
Step 8
- Try building an sankey diagram using Extensions.